
While daily life in Charlotte has seen an unprecedented disruption in March, there have been both ups and downs in crime.
CMPD has said that domestic violence calls have spiked and drug crimes have dipped. A Charlotte Observer analysis found that there were fewer overall incidents during the last two weeks of March than last year.
According to a Charlotte Observer analysis of Charlotte-Mecklenburg Police data, CMPD filed around 8,090 criminal reports in March 2019. This month, CMPD saw 7,479 incidents – around an 8% decrease.
However, the last two weeks of March – during which public schools closed and Mecklenburg County issued a stay-at-home order – CMPD saw a even more dramatic decrease in incidents.
Charlotte just posted its highest murder rate in more than a decade, prompting city leaders to say the violence should be treated as a public health crisis.
The city’s rate — 11.6 homicides per 100,000 people — is the highest since 2005 and more than double the rate from just six years ago. That year, 2014, remains Charlotte’s lowest on record. The rate takes into account population growth and is one way to look at deadly violence in Charlotte over time.
AAJA Voices 2019

I wrote the code and organized the data collection for this AAJA student project that showed that two out of three summer interns from seven top newsrooms came from among the most selective colleges in America.
After the story published, dozens of reporters and editors shared the piece on social media, citing their own barriers to breaking into journalism and demanding more economically diverse newsrooms.

Other Projects
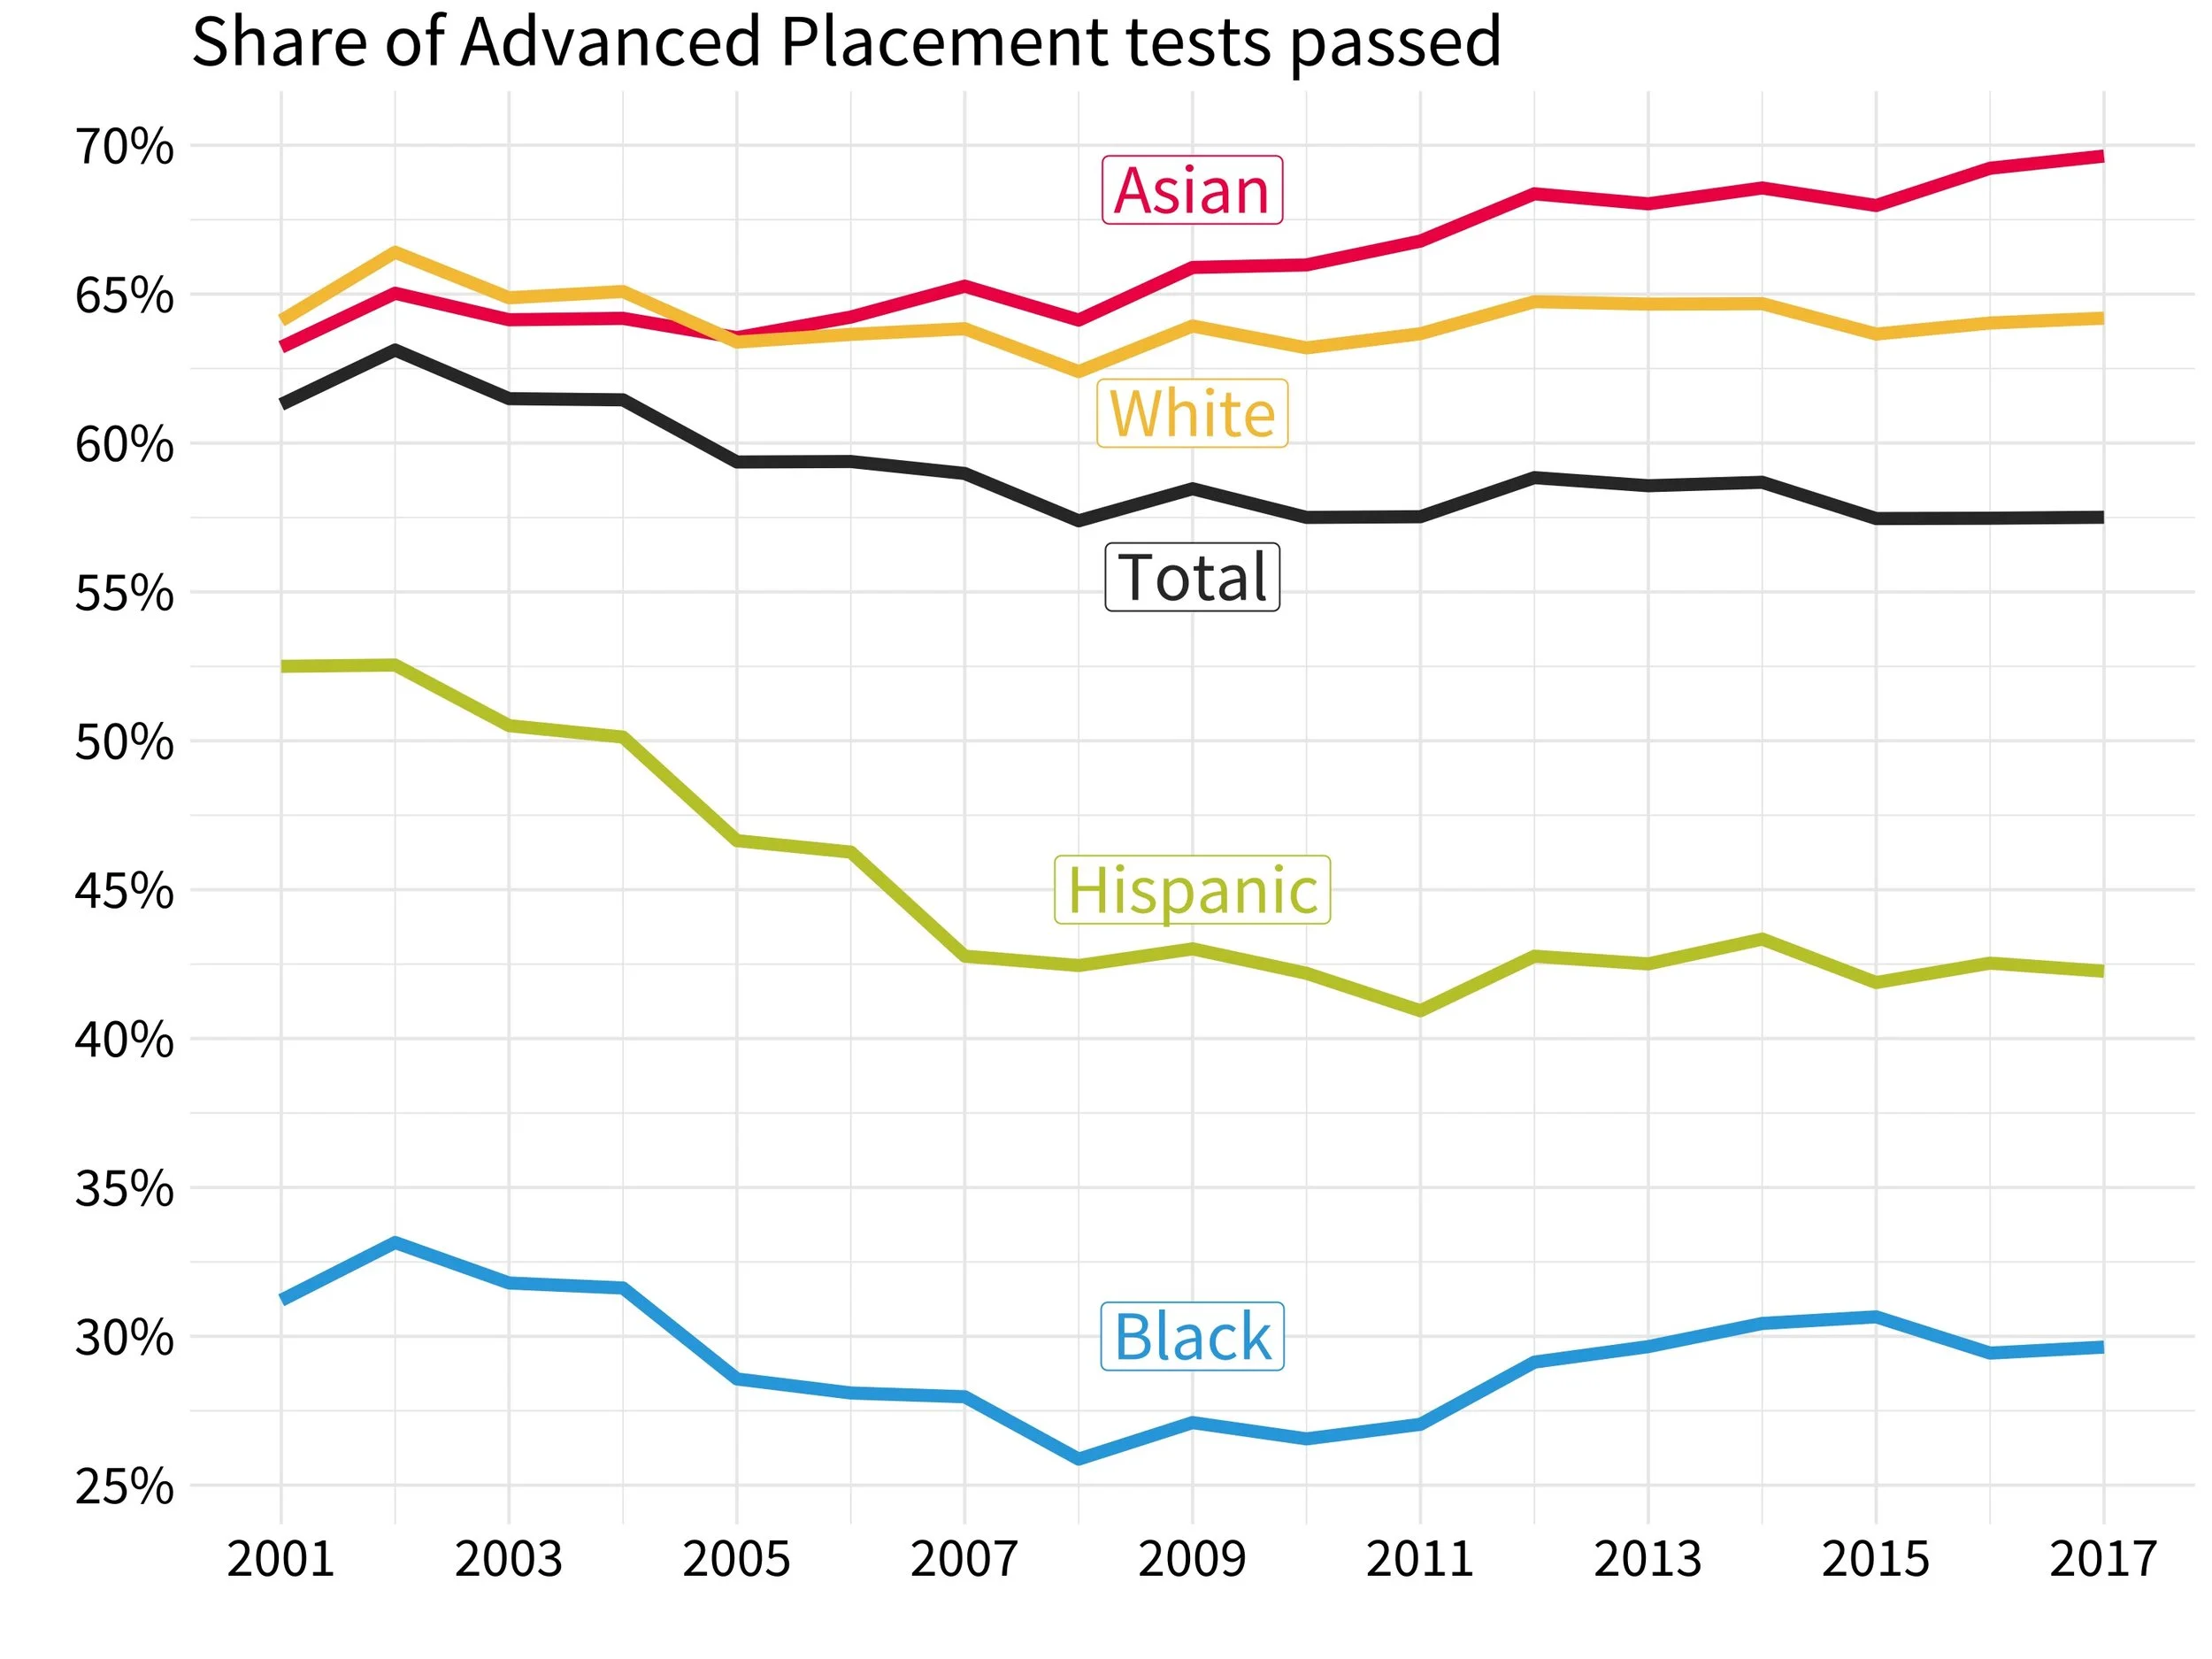
AP Exam Passrates
There’s a racial gap when it comes to scoring above a 3 on AP exams. I downloaded 17 years of data from the College Board, analyzed pass rates in R, and generated my own graph for this Chalkbeat story. (Code available on GitHub)

Median Grades by Academic Department
Some academic departments give out lower grades than others. Data was scraped from the Dartmouth registrar’s website using OutWit Hub and analyzed in R. (Project from Quantitative Social Science 17 “Data Visualization”)
A survey of Dartmouth's political landscape — A survey story covering students and their attitudes towards out-party roommates, conservative speakers, President Trump approval and recent events in Syria. This was mentioned in Nicholas Kristof's New York Times Sunday column, "Lessons Learned From 100 Days of President Trump". (The Dartmouth, 2017)